Prometheus Rules & Argus
For teams that want alerting configuration as code - version-controlled, reviewed, and deployed alongside your application - you can use PrometheusRules and dispatch the alerts to either Argus or Zabbix.
When to Use This Approach
Consider PrometheusRules if:
- You want alerting config version-controlled in your repository
- You want alerts deployed with your application via CI/CD
- You need Probe-based monitoring (health checks, SSL expiry)
- You prefer configuration files over UI-based setup
- You want the service center to act on certain alerts
For simpler use cases, Grafana Alerting may be easier.
PrometheusRules
PrometheusRules evaluate metrics and generate alerts based on predefined conditions.
Example PrometheusRule
apiVersion: monitoring.coreos.com/v1
kind: PrometheusRule
metadata:
  name: my-app-alerts
  labels:
    prometheus: system
    role: alert-rules
spec:
  groups:
    - name: my-app.rules
      rules:
        - alert: HighErrorRate
          expr: |
            sum(rate(http_requests_total{status=~"5..", namespace="my-namespace"}[5m]))
            / sum(rate(http_requests_total{namespace="my-namespace"}[5m])) > 0.05
          for: 5m
          labels:
            severity: warning
            sikt_alert: argus
          annotations:
            summary: "High error rate in my-app"
            description: "Error rate is {{ $value | humanizePercentage }}"
Required Labels
For Prometheus to pick up your rules:
metadata:
  labels:
    prometheus: system
    role: alert-rules
To route an alert, set the sikt_alert label on the rule:
sikt_alert value | Destination |
|---|---|
argus | Argus (see Argus below) |
zabbix | Zabbix (see Zabbix below) |
An alert can target only one destination. Rules without a sikt_alert label still fire in Prometheus but aren't forwarded to either system.
Best Practices
- Create PrometheusRules only for production environments to avoid noise
- Use group names matching
*.rulespattern - Verify your
expris valid before deploying - Test in staging before production
Probes (Black-box Monitoring)
Probes actively check endpoint health from outside your application.
When to Use Probes
- Monitor external endpoints
- Check SSL certificate expiration
- Verify DNS resolution
- Test HTTP response codes and latency
Example Probe
apiVersion: monitoring.coreos.com/v1
kind: Probe
metadata:
  name: my-app-probe
  labels:
    platon-monitor: "true"
spec:
  interval: 30s
  module: http_2xx
  targets:
    staticConfig:
      static:
        - https://my-app.example.com
Label with platon-monitor: "true" for automatic detection.
Default Probe Rules
Platon provides default PrometheusRules for all Probes that check:
- Endpoint is responding (probe failure)
- Probe and ping latency
- HTTP status code is in the 200–401 range
- HTTP request latency
- SSL certificate validity and upcoming expiry
For custom probe alerts, create your own PrometheusRule referencing probe metrics.
Opting Out of Default Alerts
If you want a Probe to be scraped but not generate alerts from the default rules set the label
sikt_alert_disabled: "true" on the probe target:
apiVersion: monitoring.coreos.com/v1
kind: Probe
metadata:
  name: my-app-probe
  labels:
    platon-monitor: "true"
spec:
  interval: 30s
  module: http_2xx
  targets:
    staticConfig:
      static:
        - https://my-app.example.com
      labels:
        sikt_alert_disabled: "true"
This suppresses all default probe alerts (failure, slow probe, HTTP status, SSL expiry, etc.) for that target. The probe still runs and metrics are still scraped, so you can build your own dashboards or custom PrometheusRules against them.
Argus
Argus is an alert aggregation system that consolidates alerts from Prometheus into a single dashboard.
Viewing Alerts
All configured alerts can be viewed at argus.uninett.no.
Configuring Notifications
- Log in to Argus with Feide
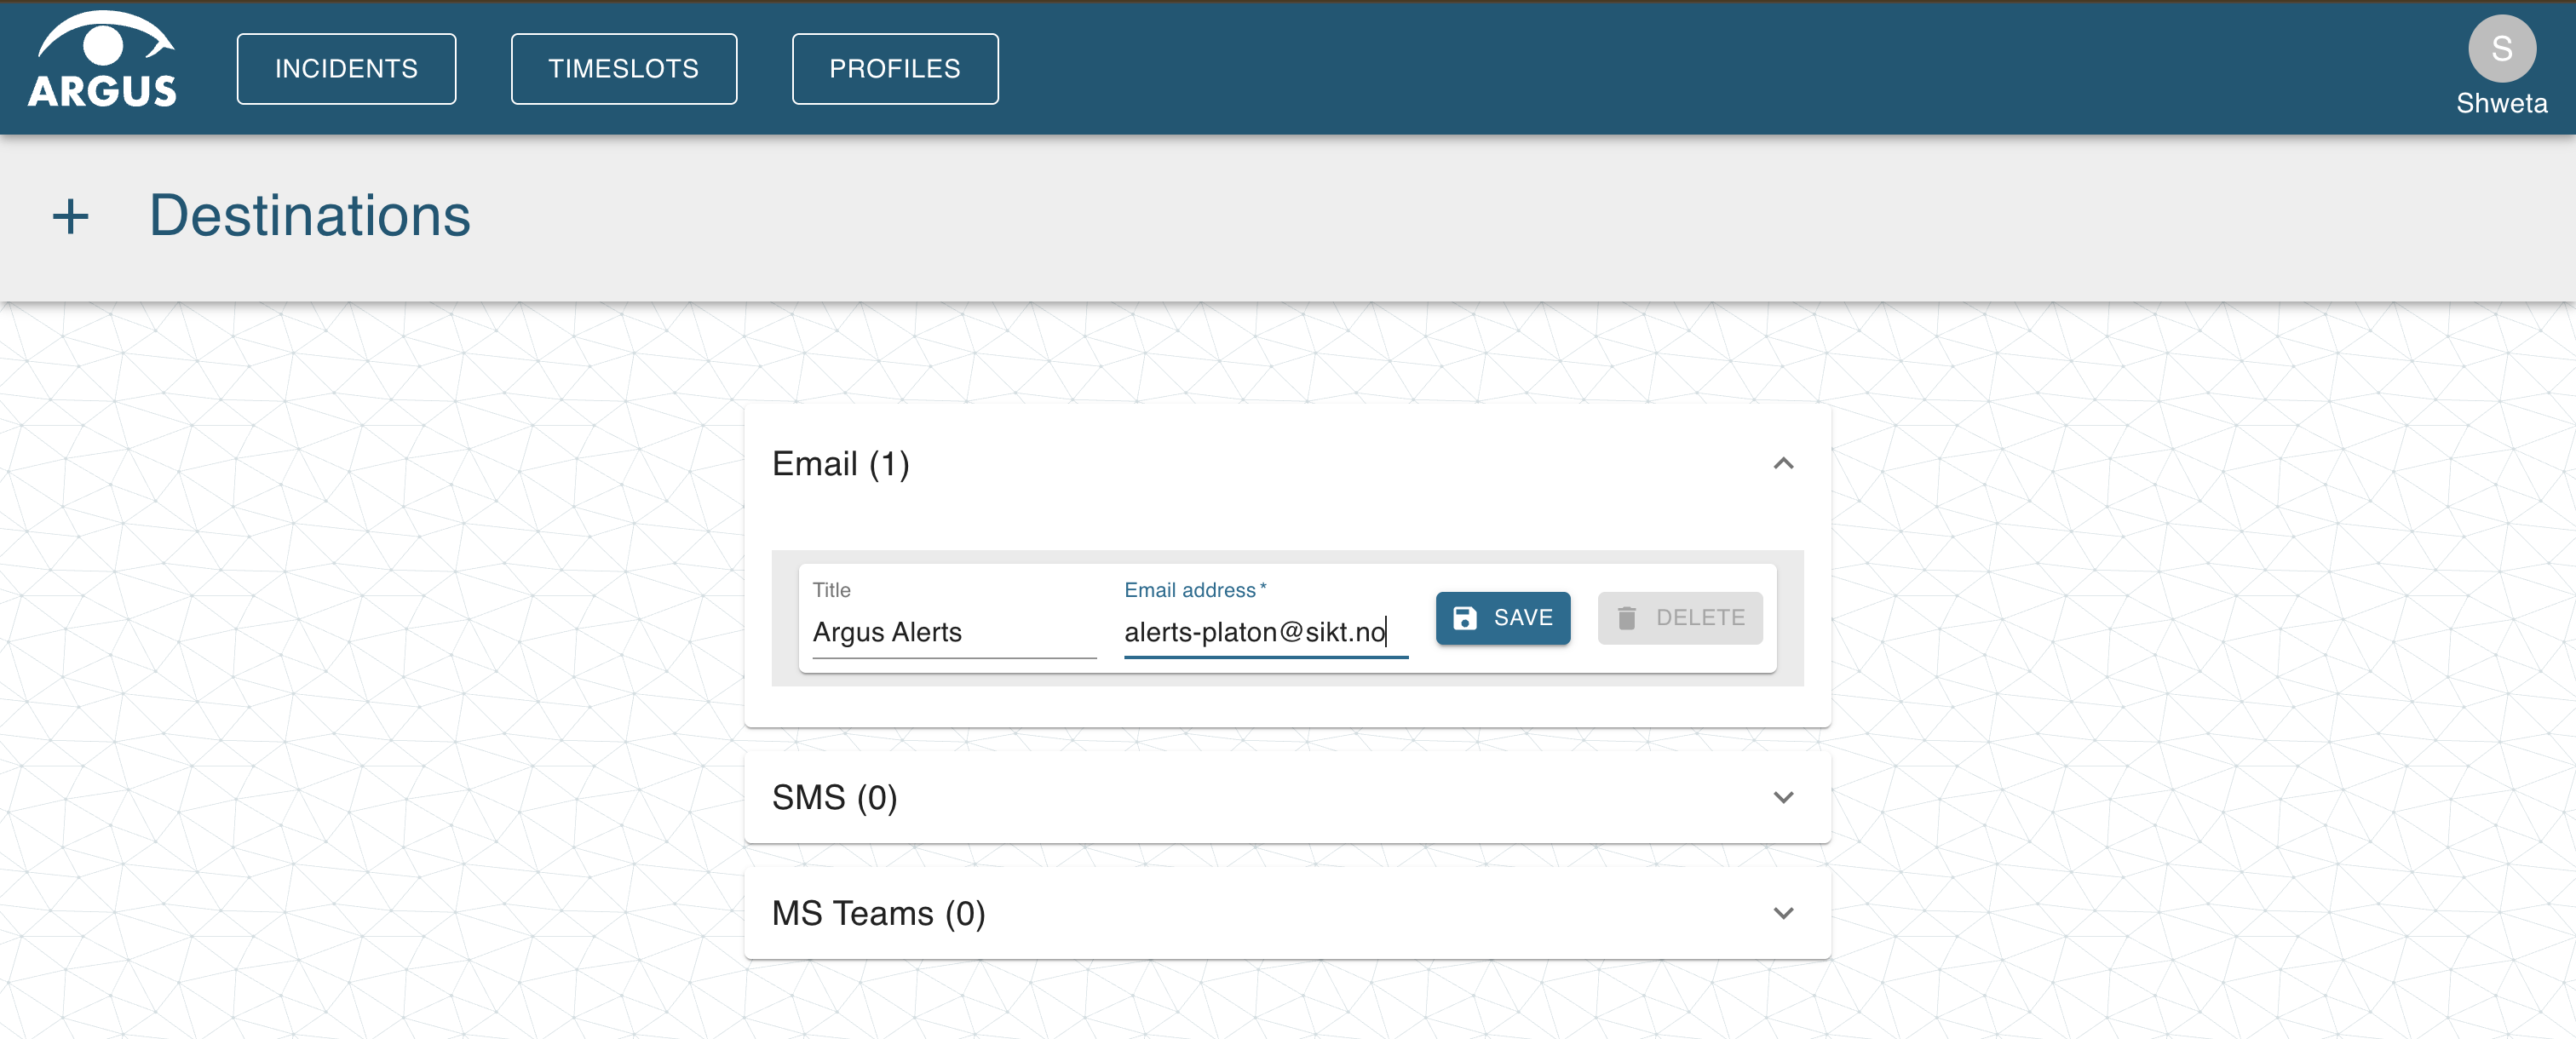
- Click your profile icon → Destinations
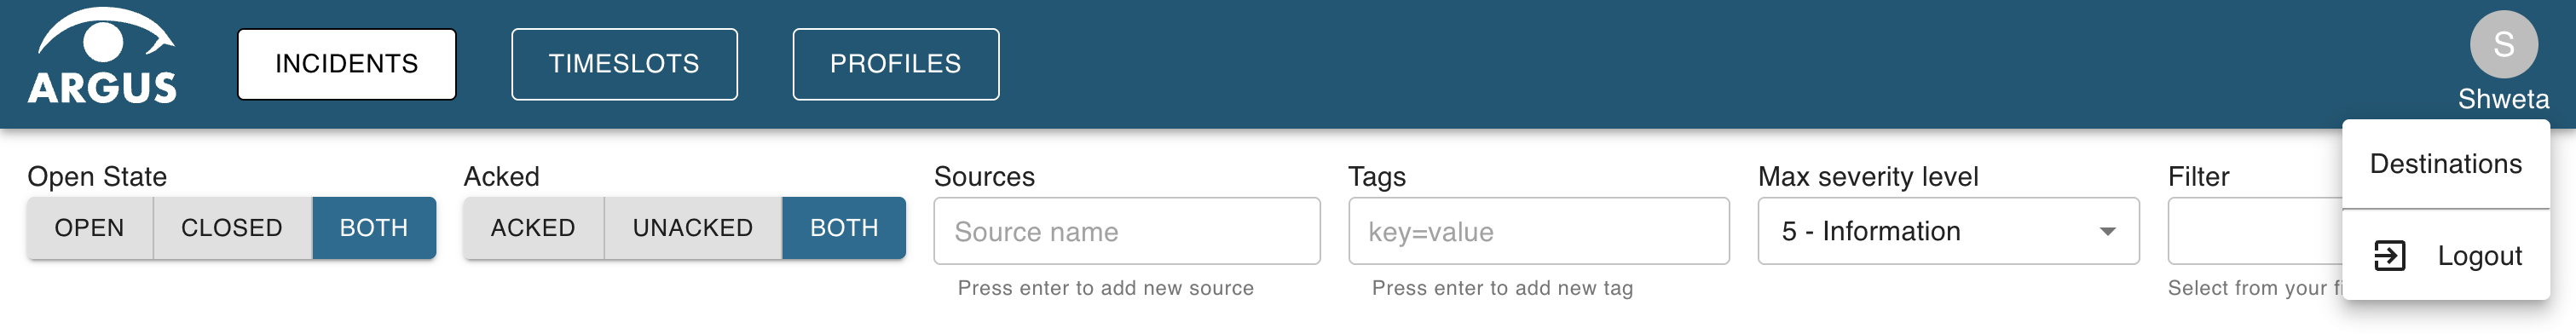
- Add a destination (email, Slack channel email, or Teams webhook)
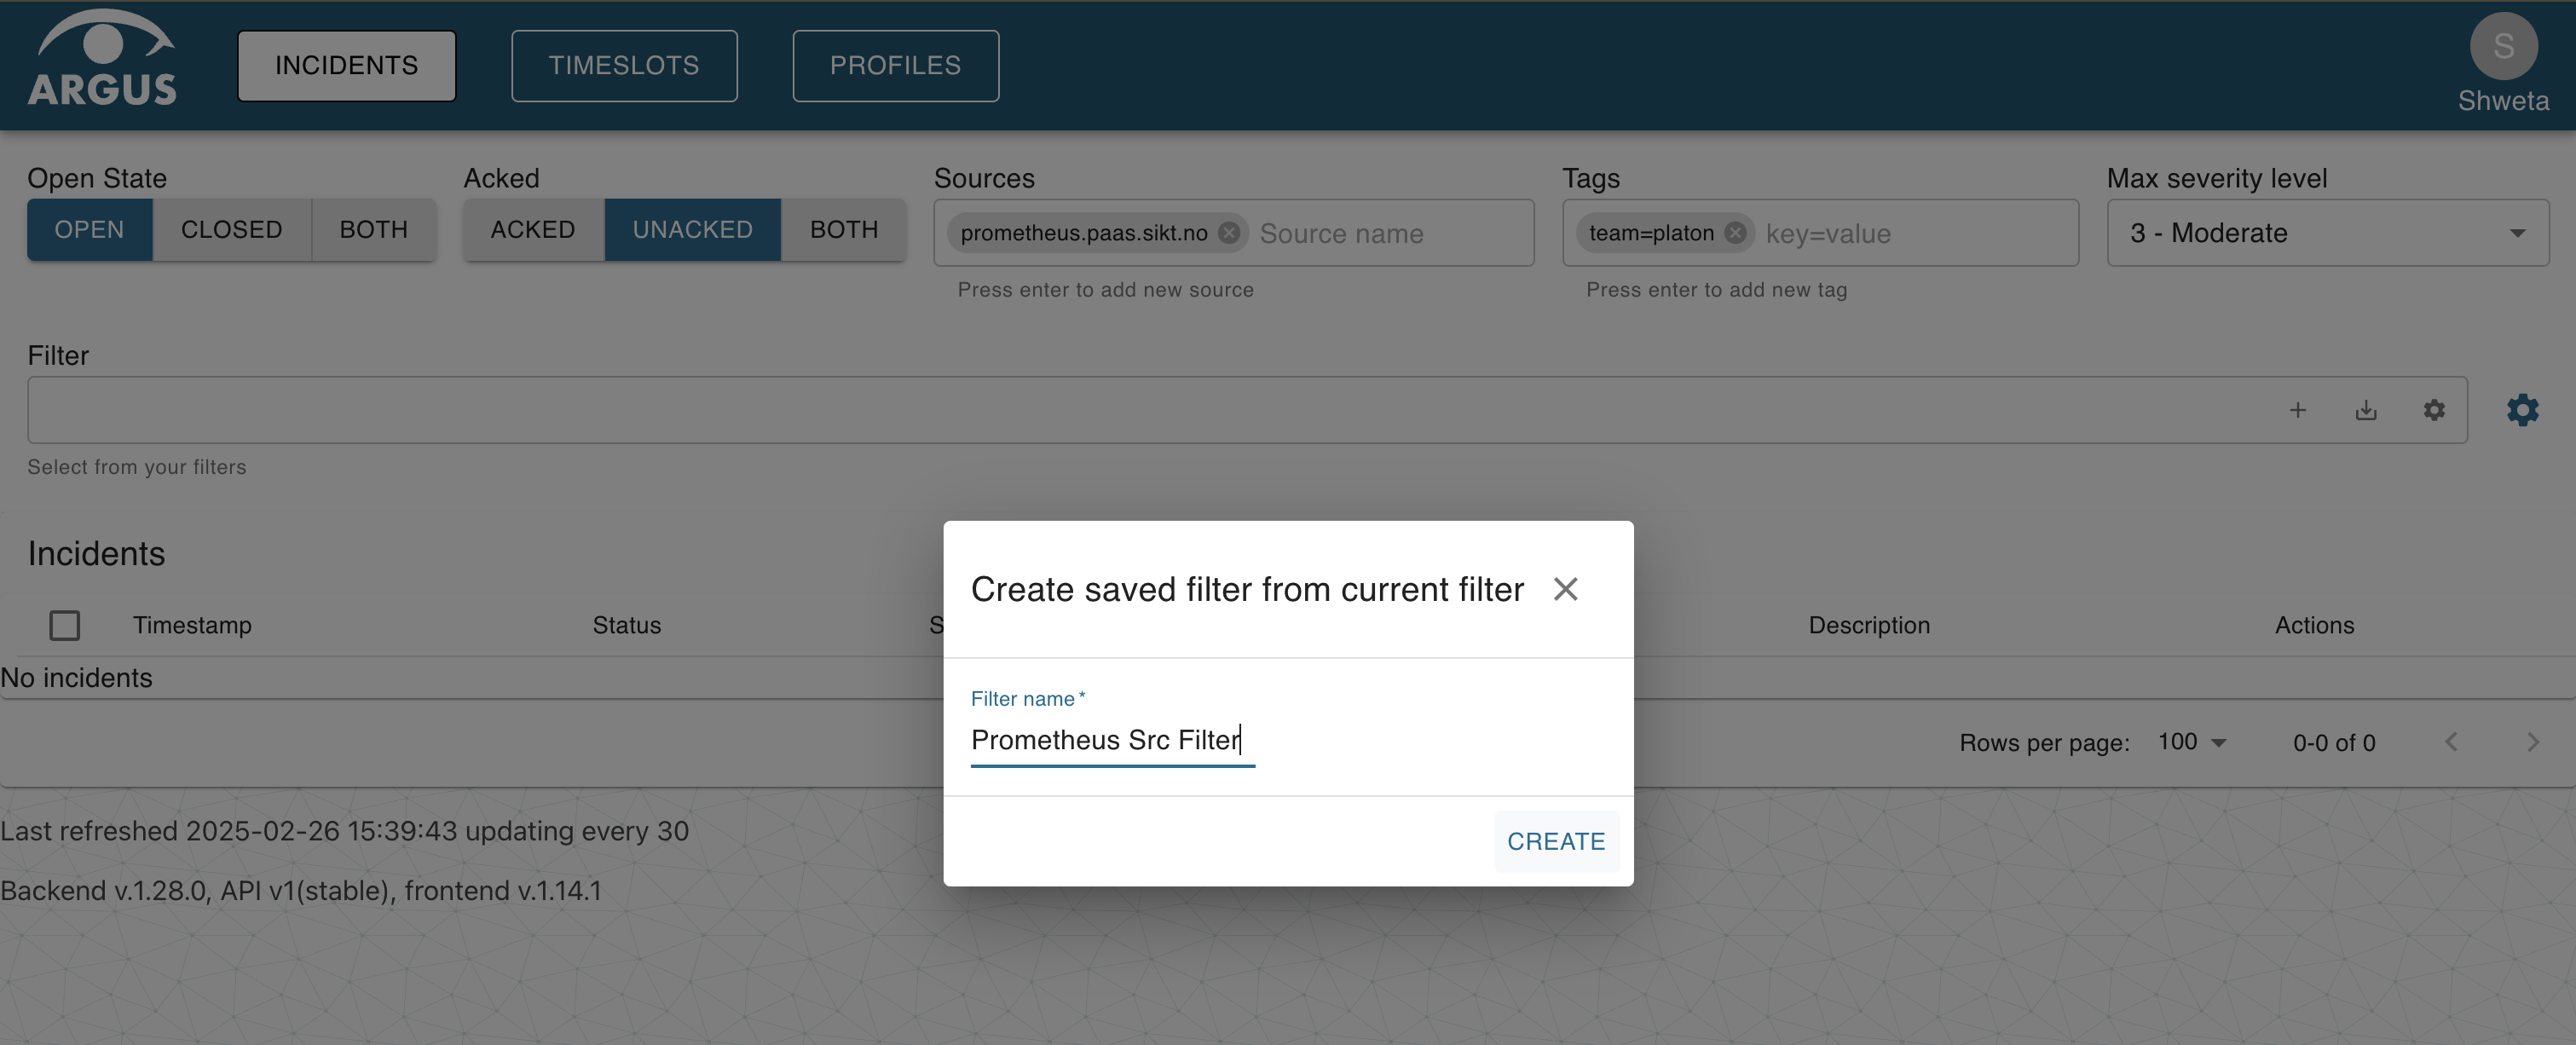
- Create a filter for your alerts (by tags, severity, source)
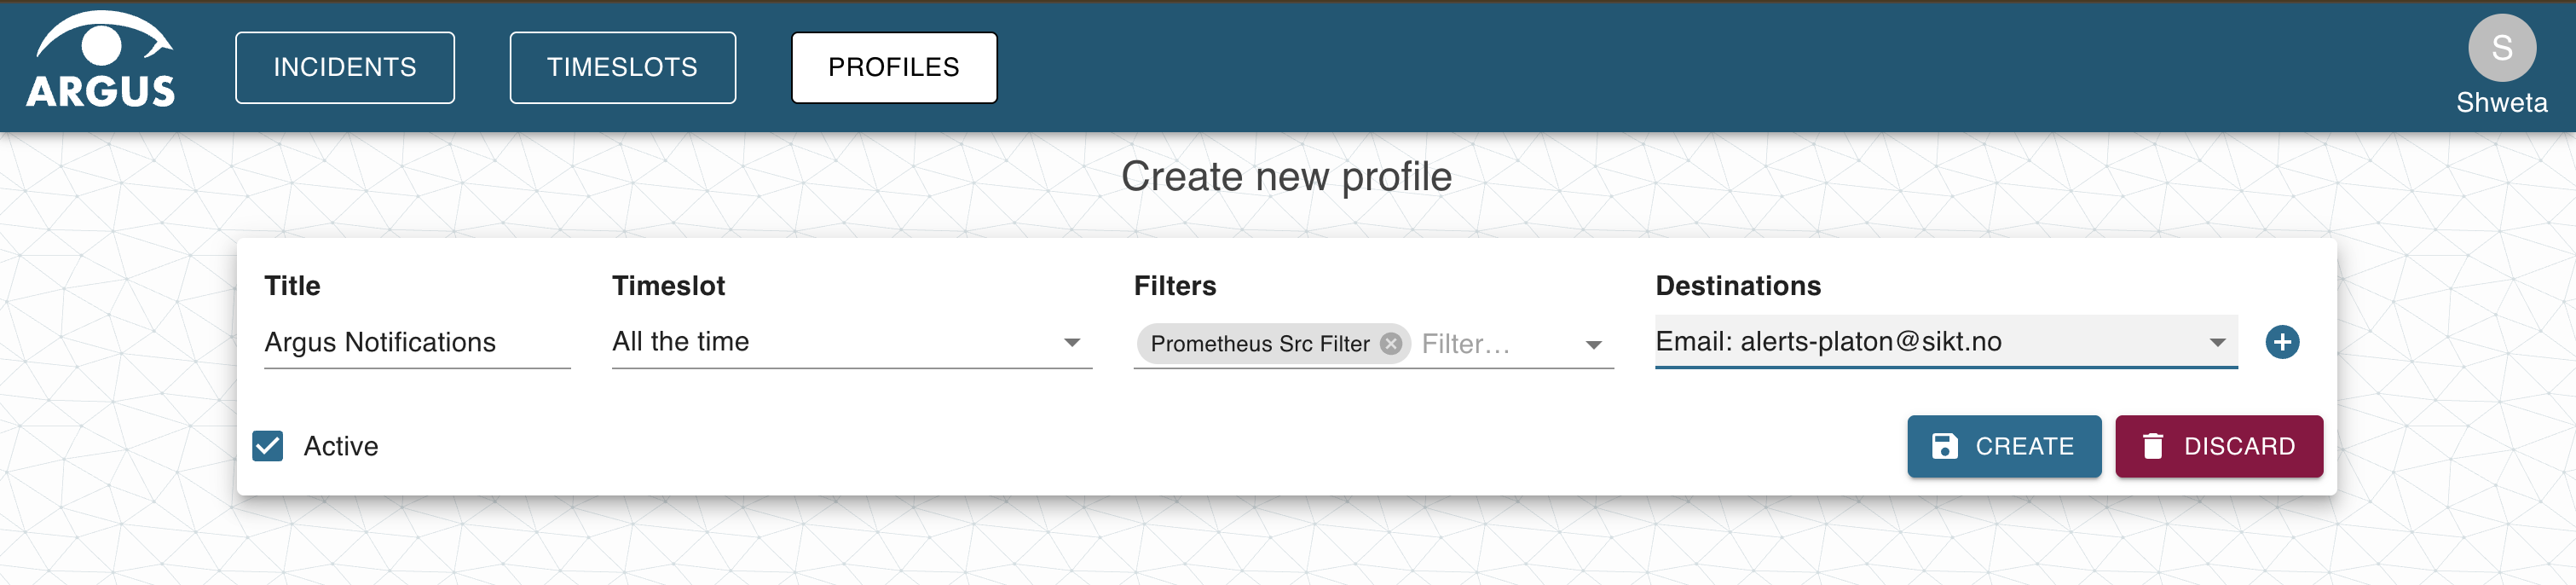
- Create a notification profile linking your filter to your destination
Severity Levels
Tag your alerts with severity for filtering:
| Severity | Argus Level |
|---|---|
| critical | 1 |
| high, error | 2 |
| medium, moderate | 3 |
| low, warning | 4 |
| info, informational | 5 |
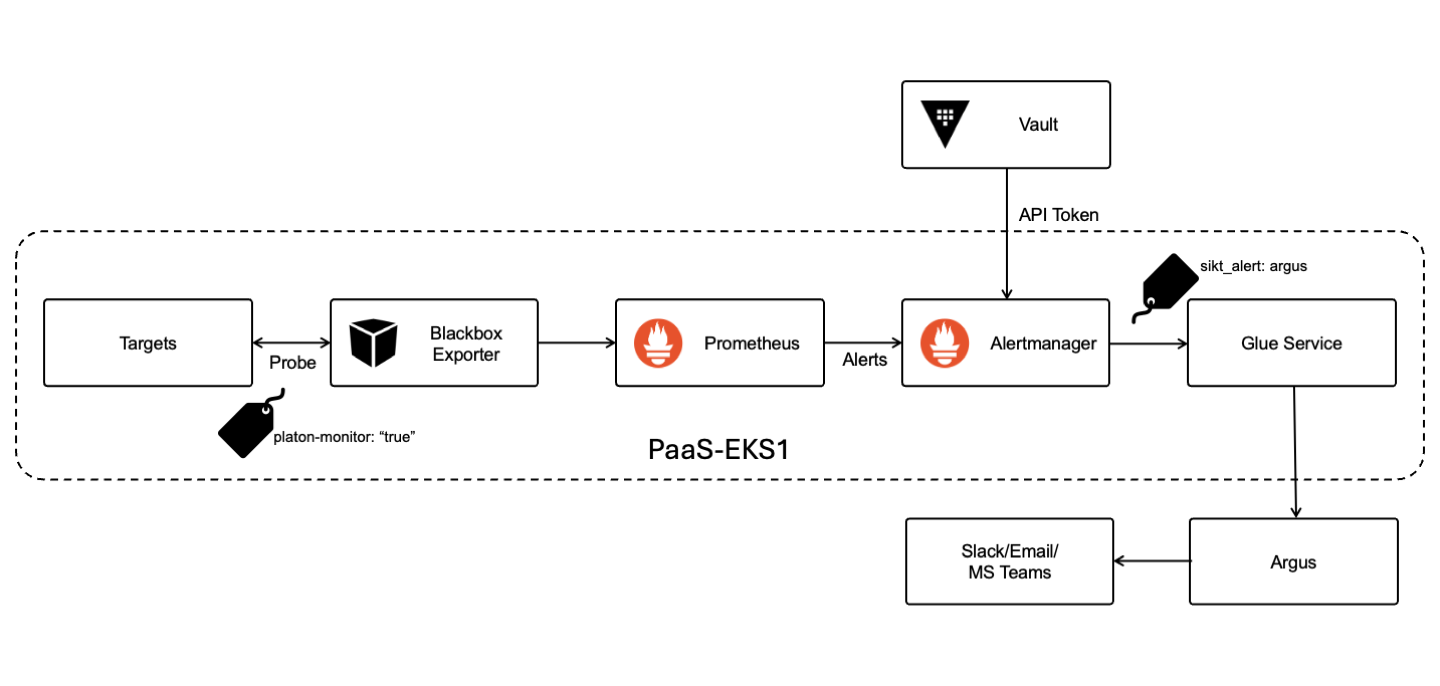
Alert Flow
Zabbix
Zabbix is the other system available as a destination for PrometheusRules.
Argus or Zabbix?
- Argus — if you just want to fire the alert and don't need any post-processing.
- Zabbix — if you already use it for other monitoring, or you need its broader feature set.
- Sikt Service Center can monitor either, but only if this has been agreed in advance and the procedures they are to follow are in place. Contact SSC to arrange this.
Prerequisites
Before alerts can be received, a Zabbix host must exist for your service. Coordinate with Platon to have a host registered — the host name you choose is what you'll reference in your rule annotations.
Routing an Alert to Zabbix
Add the sikt_alert: zabbix label and a zabbix_host annotation, example:
- alert: MyServiceDown
  expr: up{job="my-service"} == 0
  for: 5m
  labels:
    severity: critical
    sikt_alert: zabbix
  annotations:
    summary: "my-service is down"
    zabbix_host: my-host    # must match a registered Zabbix host
sikt_alert: zabbix(label) routes the alert through AlertManager to the Zabbix webhook.zabbix_host(annotation) tells the webhook which Zabbix host to record the alert against. Required.
Severity Mapping
Zabbix uses its own severity levels — see Zabbix severity best practices. The severity label on your rule does not influence Zabbix severity directly; configure that on the Zabbix host item.