Metrics & monitoring
To create alerts based on logs, it is recommended to use Grafana. The implementation of this functionality in Platon is currently underway, so it is not yet available. In parallel, we are testing Argus, a newly implemented system designed for production environments. Argus sends alerts based on Prometheus rules or probes, typically used for health checks and similar purposes.
In Platon PaaS, we plan to phase out alerting to Zabbix over time. Until all necessary features are in place in Platon, Zabbix can be used temporarily if no other alternatives are available.
Web interfaces
Feide is used for user authentication.
Prometheus expression browser
Prometheus is a powerful open-source system monitoring and alerting toolkit. It is designed to handle multi-dimensional data collection and querying. With Prometheus, you can collect metrics from configured targets at given intervals, evaluate rule expressions, display the results, and trigger alerts if certain conditions are met.
The expression browser is available at prometheus.paas.sikt.no, allowing you to enter any expression and see its result either in a table or graphed over time.
This is primarily useful for ad-hoc queries and debugging.
To learn about how to write queries in Prometheus, see the official documentation
Grafana
Grafana is a multi-platform, open-source analytics and interactive visualization web application. It provides charts, graphs, and alerts for the web when connected to supported data sources. Grafana is most commonly used for visualizing time series data for infrastructure and application analytics. It's user-friendly interface and numerous out-of-the-box features make it a go-to tool for creating effective and visually appealing dashboards.
Go to grafana.paas.sikt.no for dashboards and visualization on your applications running in PaaS. There is a wide range of dashboards ready-made for looking at resource usage of your containers.
Custom dashboards cannot be created on grafana.paas.sikt.no. This functionality will be introduced in the upcoming Platon Observability Platform, which is currently under development.
Monitoring & Alerting
Zabbix
Zabbix is an enterprise-class open-source distributed monitoring solution designed to monitor and track the status of various network services, servers, and other network hardware. Zabbix uses a flexible notification mechanism that allows users to configure email-based alerts for virtually any event. This allows a fast reaction to server problems.
Contact Platon for initial Zabbix configuration & access
Prometheus uses Alertmanager to send alerts to Zabbix.
python-metrics-hello is an example project of how this is configured. This example project also shows how to expose custom metrics in your application to Prometheus.
If you want Sikt Service Center to act as 1st line support for your application see the Ordering SCS monitoring page.
Argus
Argus is an alert aggregation system designed to consolidate and manage IT infrastructure incidents from multiple monitoring systems into a single, coherent dashboard. It provides a REST API for handling incidents and user notification profiles, along with a separate web-based frontend for user interaction. Argus does not perform monitoring itself but relies on reports from external source systems to streamline incident management and notification processes. Refer to Argus docs for more details.
Alerts can be configured to send to Argus from Prometheus using either Probe resource or by directly setting up PrometheusRules resource, depending on your needs.
When to use Prometheus Rules?
PrometheusRules evaluate metrics already collected from exporters or instrumented applications and generate alerts based on predefined conditions. You can use PrometheusRules when your system is already exporting metrics, and you need to define thresholds or conditions for alerts or when you want to create alerts based on historical trends, such as CPU usage spikes, disk space running low, or failed HTTP requests.
Prometheus Rules
You can create a PrometheusRule to define conditions for alerts based on existing Prometheus metrics. A PrometheusRule is essentially a Prometheus query that defines alert conditions, for example a PrometheusRule which defines a rule to alert on high error rates exceeding threshold. Alerts generated from all the PrometheusRules that are labeled sikt_alert: argus are propagated to Argus.
-
It is recommended to create Prometheus Rules only for production environments to avoid unnecessary noise in Argus.
-
It is necessary to use the code, this allows prometheus to pick up the alerts from your application automatically.
metadata:
  labels:
    prometheus: system
    role: alert-rules
-
The prometheus rules groups names need to follow a pattern like
*.rules, making it easier to manage multiple alerting rule groups. -
Make sure to double check the expr is correct and all the variables used in the summary, description and expr are valid. You could log the prometheusRule.yaml in the console to see if the variables are subsituted correctly as shown here.
-
When configuring rules or ingress, always use the port that your application is running on, rather than the one shown in the example application as the example may be using a different port.
When to use Probe?
A probe is typically used when you need to actively check the health or availability of an endpoint, which allows you to perform HTTP, TCP, DNS, or ICMP (ping) checks. Probe is useful when you want to monitor external endpoints, check network availability, latency, or SSL certificate expiration or you are dealing with black-box services where you can't modify the internal application to expose metrics.
Probe Resource
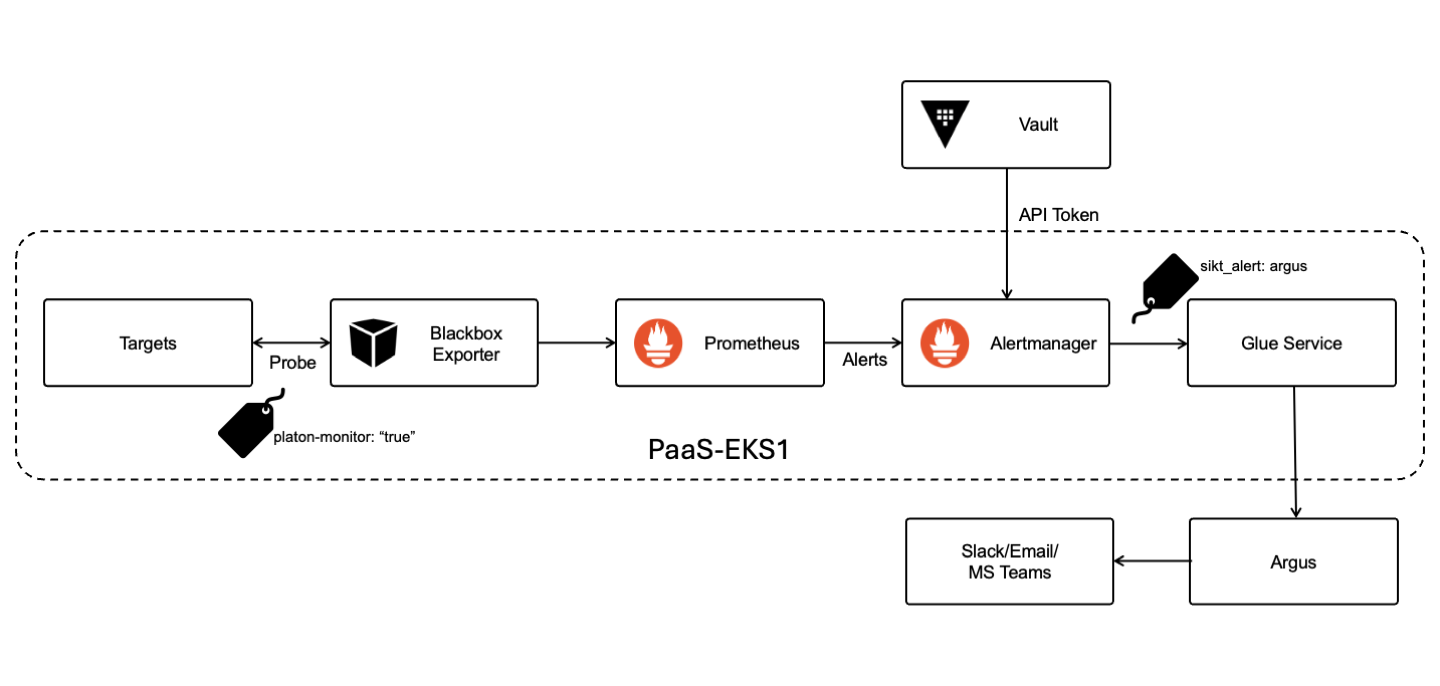
Platon runs a Blackbox exporter that automatically detects any Probe resource labeled with platon-monitor: "true" and sends metrices to Prometheus. The hello-blackbox-probing project demonstrates how to configure a Probe resource for your application. The Probe is configured in the probe-website.yaml and contains the labels that teams need to define to tag their application appropriately.
There is a set of default PrometheusRules setup for Probes by Platon. These "default" rules apply to all Probes labeled with platon-monitor: "true" and handle common checks, such as verifying if the endpoint is responding or if the certificate is valid. The rationale behind these default rules is that they address standard monitoring needs that are likely to be consistent across most use cases. However, if you want to have your own custom PrometheusRules for Probes which are not covered in the default setup by Platon, then you can follow the hello-blackbox-probing example to setup your own PrometheusRules. In the hello-blackbox-probing application, the PrometheusRule is defined in prometheusRule-slow-dns.yaml to alert whenever the probe lookup time exceeds threshold, indicating slow DNS resolution. Alerts generated by the PrometheusRules with the label sikt_alert: argus are then propagated to Argus.
All configured alerts, whether through on Probe resource or just PrometheusRules, can be observed in the Argus UI.
Labels
It is recommended to tag your alerts with appropriate labels, this will help you to filter them and ensure that correct alerts are sent to the desired destinations. Labels can be added to the targets in a Probe, but also directly to a PrometheusRule. An example of these labels can be found in the hello-blackbox-probing, apart from the labels mentioned in the example you can create your own labels according to your needs. For Argus to be able to filter alerts based on severity, all the alerts should be tagged with a severity label. Severity labels in Argus are defined from 1-5, where 1 being the critical and 5 as information. Here is the mappings of labels that can be used for the severity.
severity_levels = { "critical": 1, "high": 2, "error": 2, "medium": 3, "moderate": 3, "low": 4, "warning": 4, "info": 5, "informational": 5, "information": 5, }
The label sikt_alert: argus should never be in targets in a Probe, only in PrometheusRule . If put on Probe it would make all default Probe PrometheusRules to propagate to Argus when we only want some of them to be propagated.
Notifications
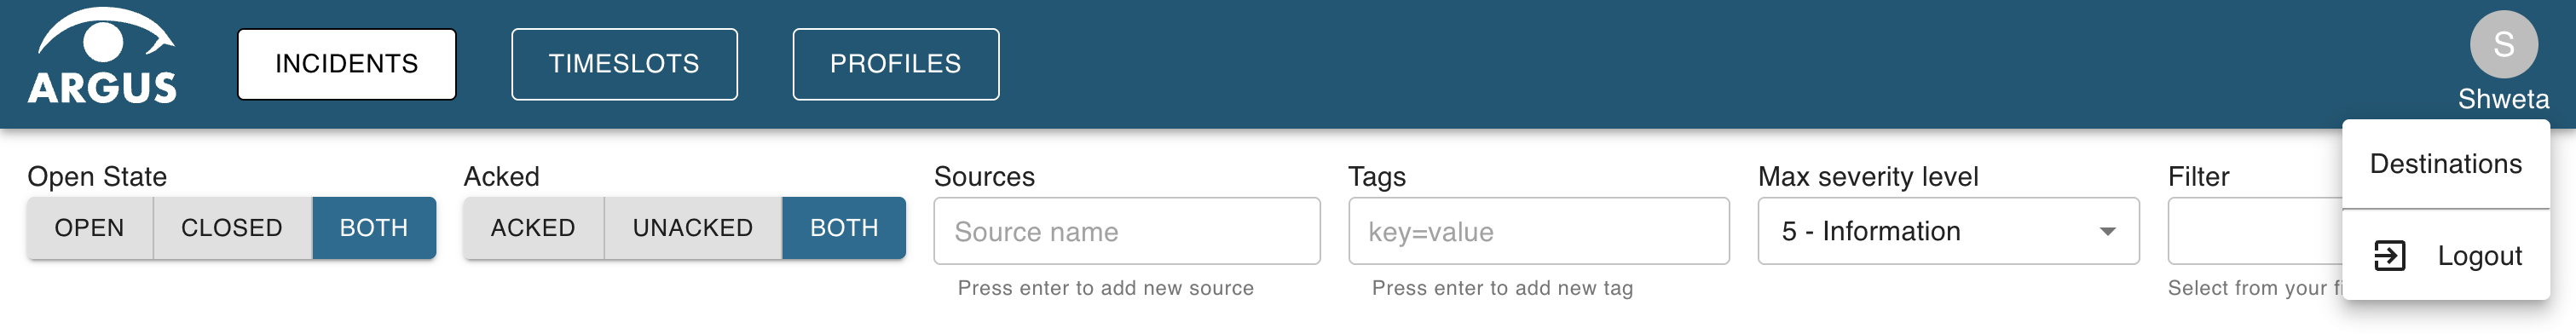
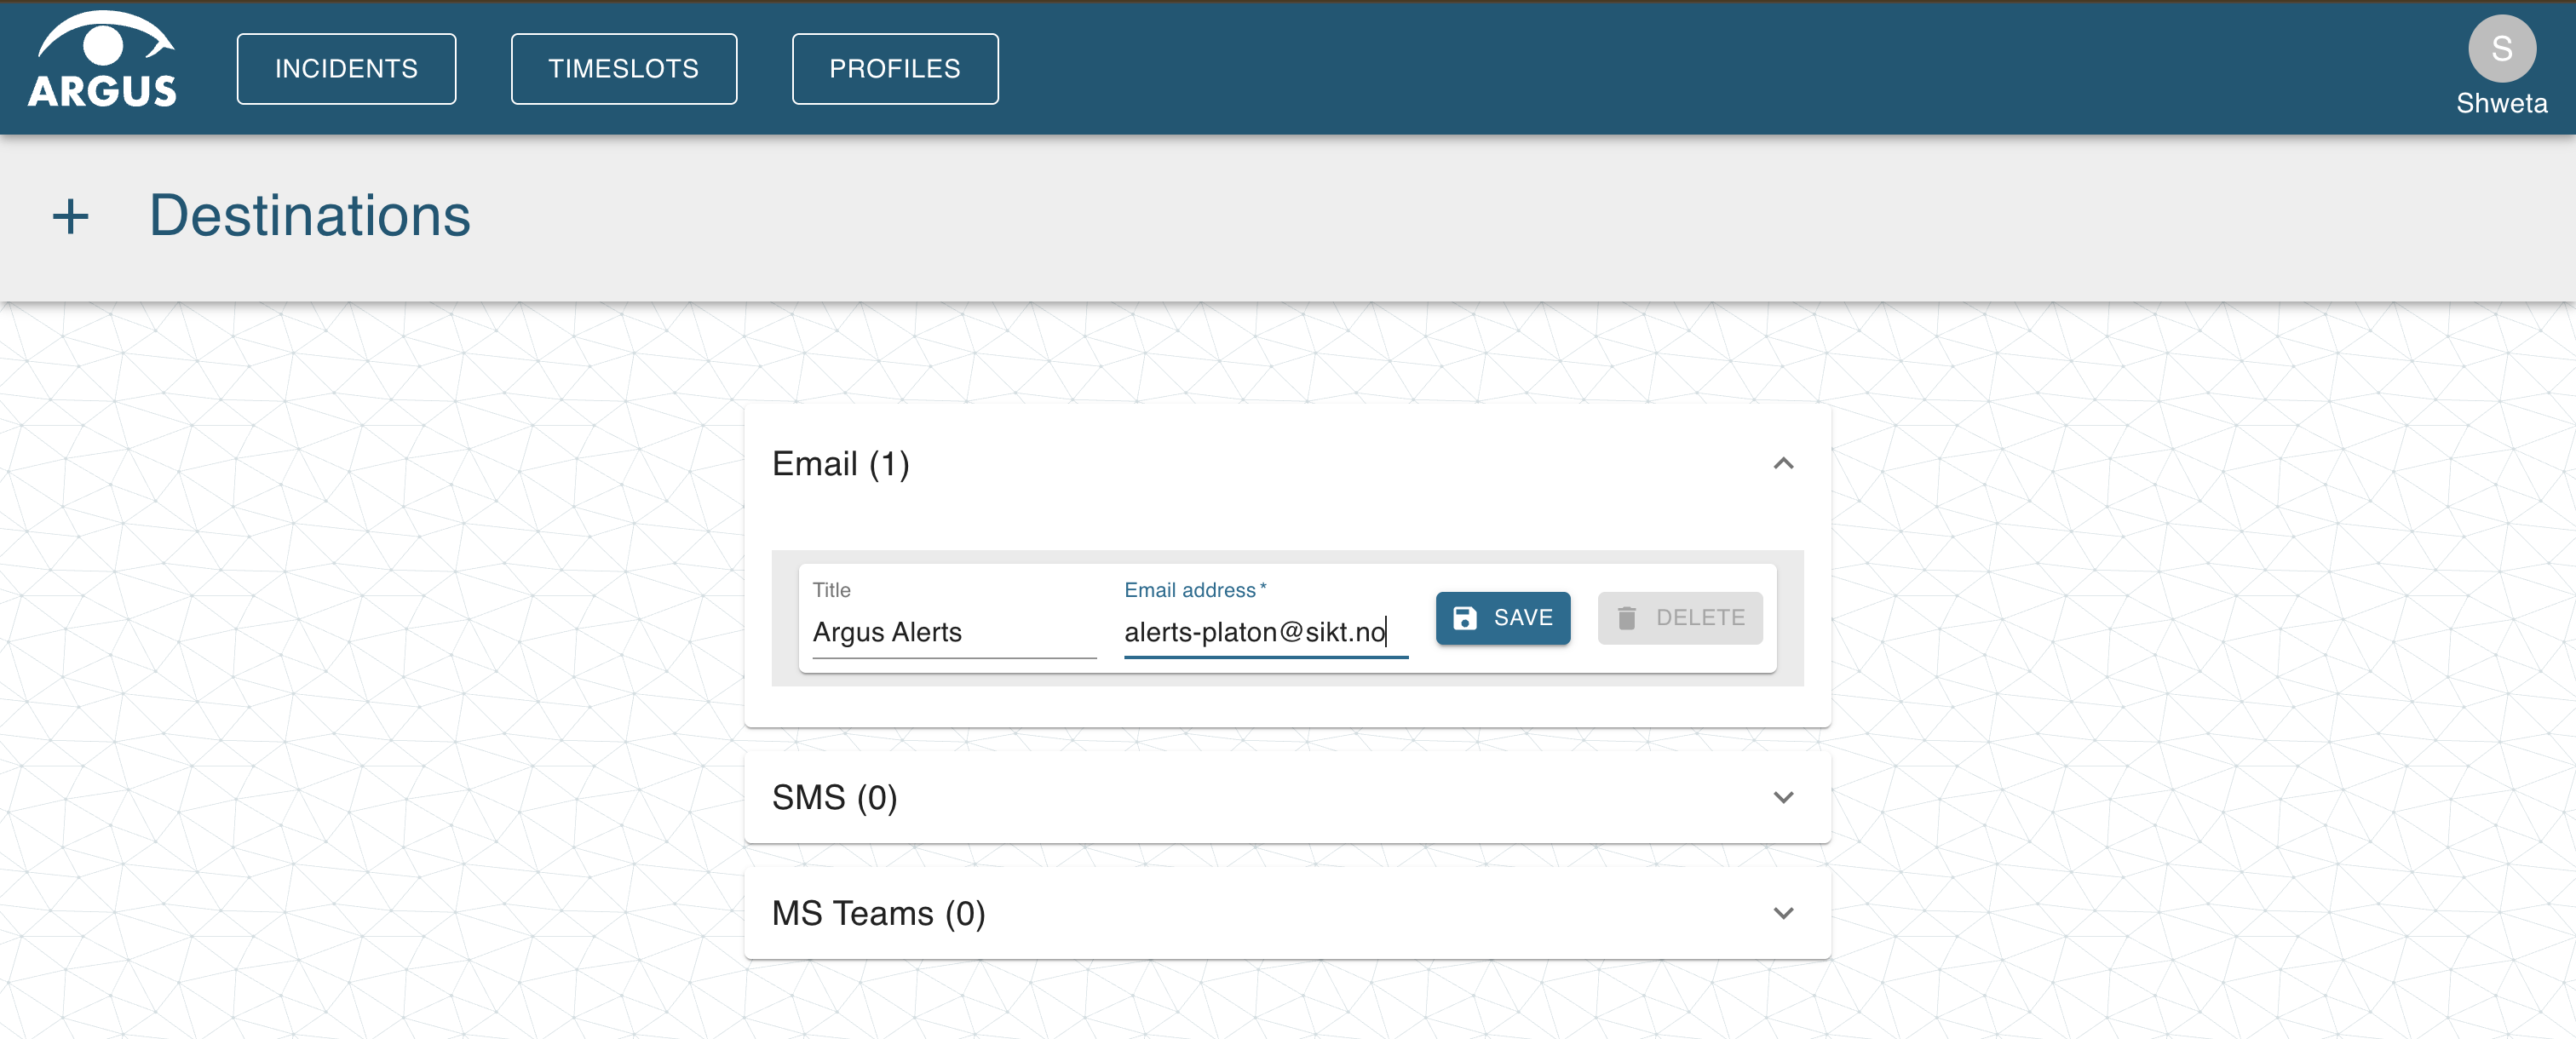
Users can configure notification in Argus to send alerts to Slack/Email, SMS or MS-Teams. To configure notifications in Argus, a user should login to Argus UI via Feide and then navigate to destinations on the top-right corner under the user icon.
In the destinations page, add email/slack-channel-email in the email-address field and a relevant title for the destination where the alerts will be sent. For configuring MS-Teams channel or SMS follow Argus docs.
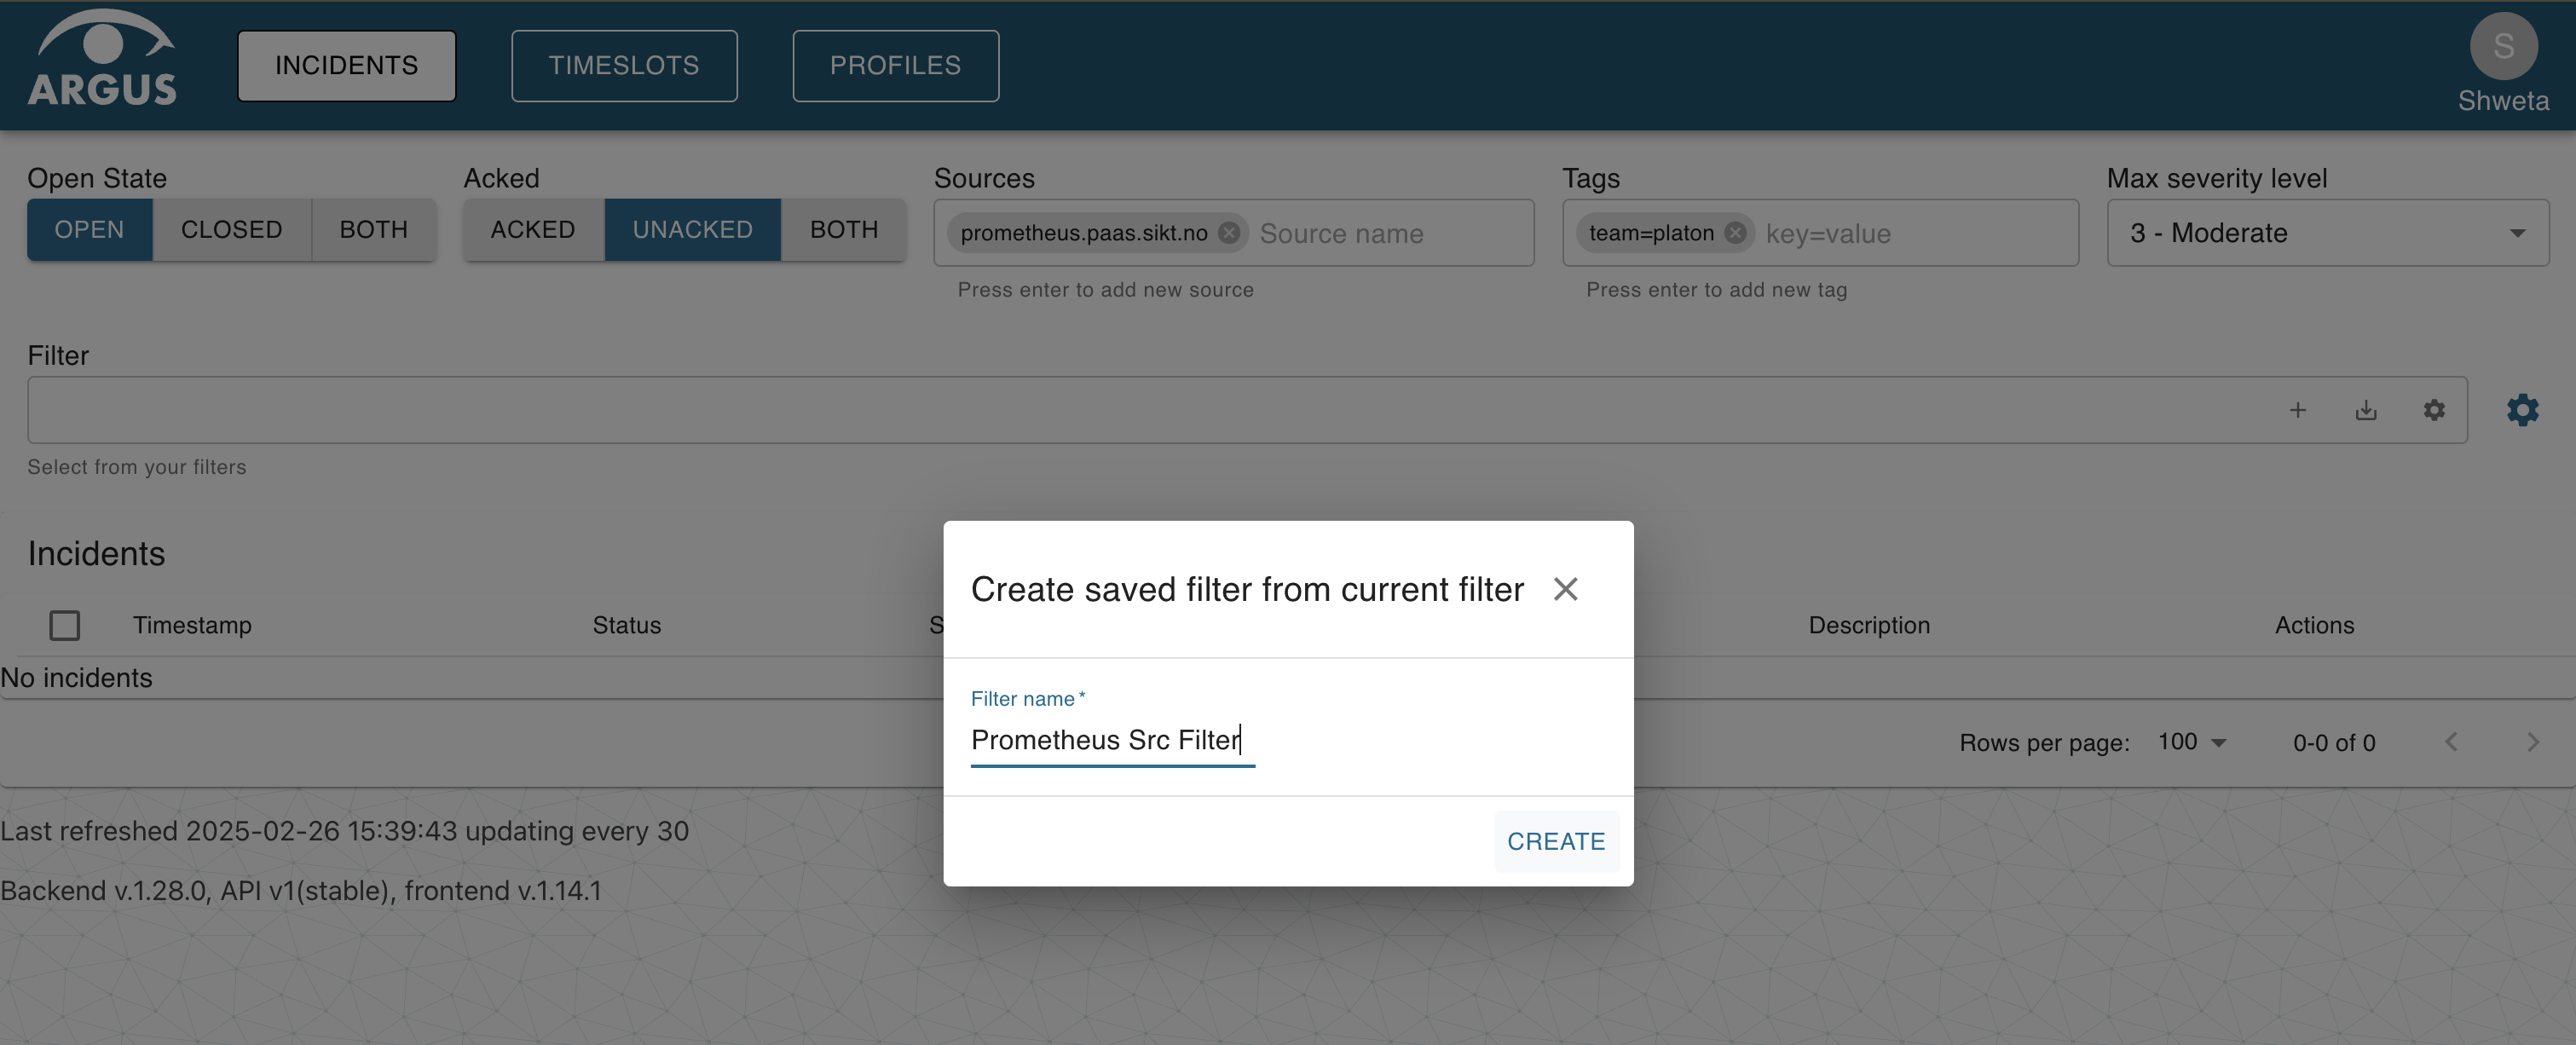
After adding a destination, create a filter for the alerts or as argus calls it - incidents and save it. The alerts can be filtered based on state (open, closed or both), acknowledgement, sources, tags and severity level. The labels on the PrometheusRules can be used as Tags in Argus to filter the alerts. Once the parameters for filtering have been selected, click on the + icon to create a new filter. To modify the existing filters click on the settings icon.
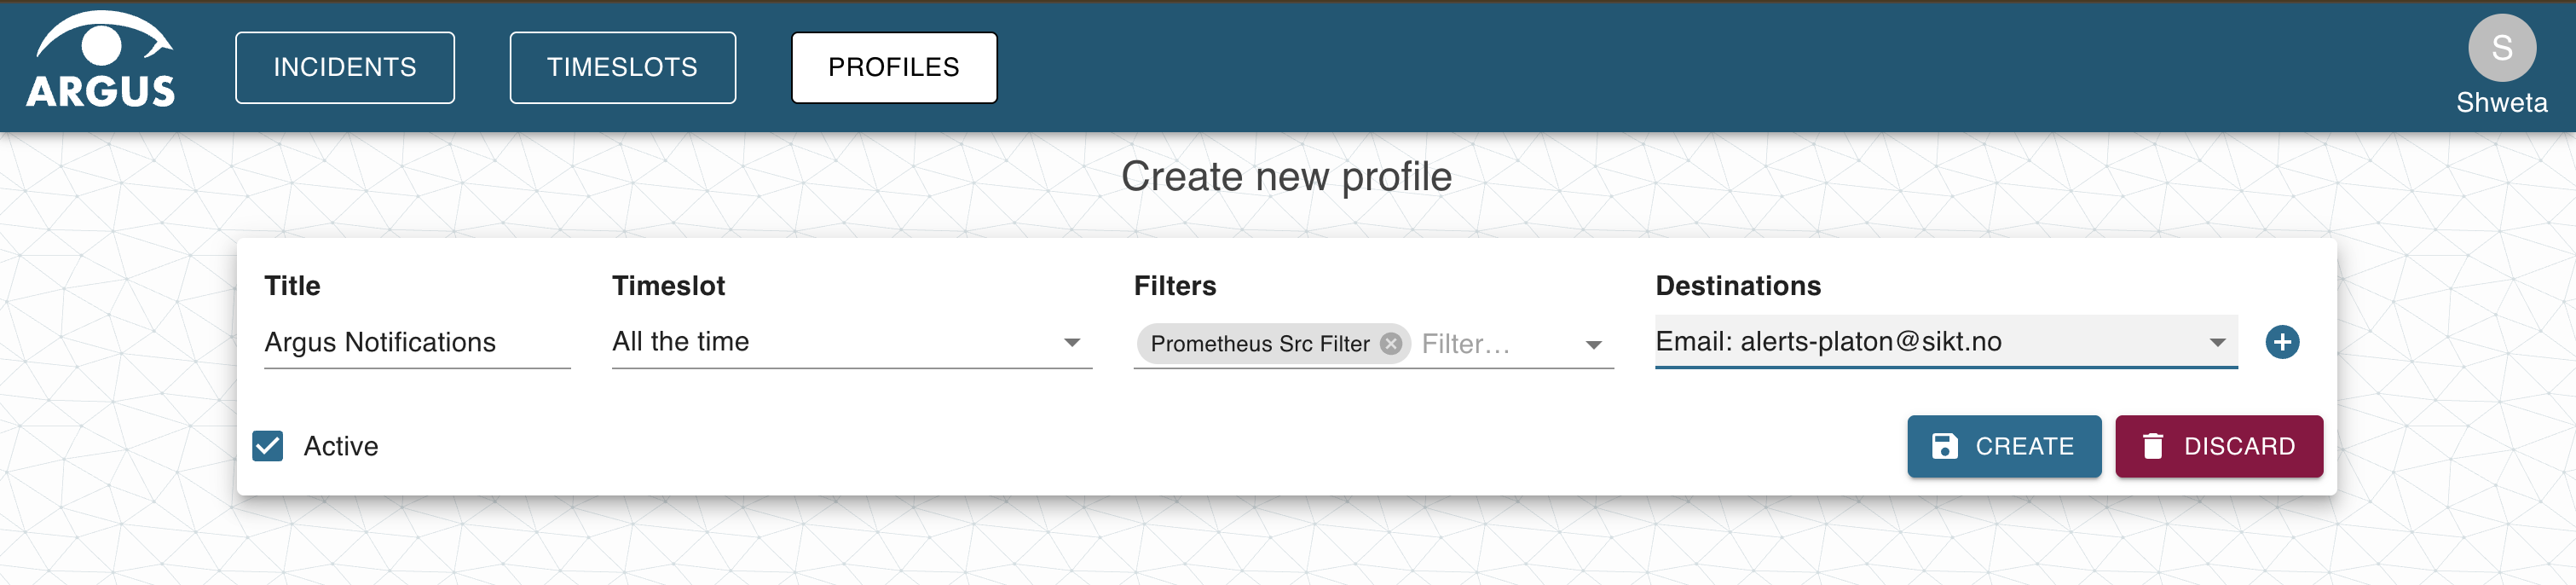
Finally, create a profile stating the filter that was created before for alerts and mention the destination where the alerts should be sent. Now, the alerts should start popping up on the desired destination. For more information about configuration, refer to Argus docs.
All users in Argus have access to all alerts.
Complete picture of the flow of alerts from applications to Argus