Learn about OpenTelemetry on Platon
This tutorial introduces OpenTelemetry (OTel) on Platon for teams that already use logs and want to add metrics and traces to the picture. It covers what OTel is, what comes for free when you enable it, and how telemetry flows through Platon.
Why OpenTelemetry exists
Logs alone answer "what happened?", but they do not answer two questions most services need to answer:
- Which one of these 100 requests was the slow one, and why?
- How is this endpoint behaving this week compared to last week?
The first question is what traces are for. The second is what metrics are for. Together with logs, they make up the "three signals" of modern observability.
OpenTelemetry (OTel) is the industry's converging standard for producing those signals in a vendor-neutral way. It is a CNCF graduated project, and most major languages, frameworks, and backends speak it natively. Adopting OTel on Platon means your application emits telemetry in the standard shape, and Platon's backends (Loki, Mimir, Tempo) receive it without translation.
The three signals
Logs are timestamped events — "user 42 clicked enroll", "database query failed with timeout". They answer what happened on a specific request. In Grafana you read them in the Loki data source.
Metrics are aggregated numerical measurements over time — "the enrollment endpoint saw 430 requests in the last minute at a p95 latency of 120 ms". They answer how often, how fast, and how big. You graph them and alert on them. In Grafana you query them from the Mimir data source.
Traces are timelines of a single request as it crosses services. When the enrollment-service calls the eligibility-checker which calls the course-catalog, one trace captures all of it: which service, how long, what went wrong. A trace consists of spans, one per operation. Traces answer why a specific request was slow, and how a request moved through the system. In Grafana you read them in the Tempo data source.
A trace crossing three services looks like this:
enrollment-service  ├──────────────────────────────────────────── 320ms ─┤
   eligibility-checker    ├──────── 80ms ─┤
   course-catalog                         ├── 40ms ──┤
   database                                      ├─ 30ms ─┤
That is four spans, parent-to-child, in one trace. A slow request is visible at a glance without searching logs.
What OpenTelemetry actually is
A vendor-neutral standard. OTel defines how telemetry looks: the shape of a span, the structure of a metric, the correlation between a log and the trace it belongs to. Your application emits telemetry in that shape, and any compliant backend receives it. This is why the industry is converging on it — switching observability vendors does not require rewriting instrumentation.
A set of libraries that do most of the work for you. When you add the OTel SDK to your application, it comes with auto-instrumentation for common libraries: your HTTP server, your HTTP client, your database drivers, your logging framework. Usually a single line of setup yields useful traces, metrics, and log correlation without touching any business logic.
You can still add custom instrumentation — a span around a specific business operation, a counter for a domain-specific event — on top of the auto-generated signals. The example apps in the otel-examples repo each show both: what comes for free, and what they have added on top.
How telemetry flows on Platon
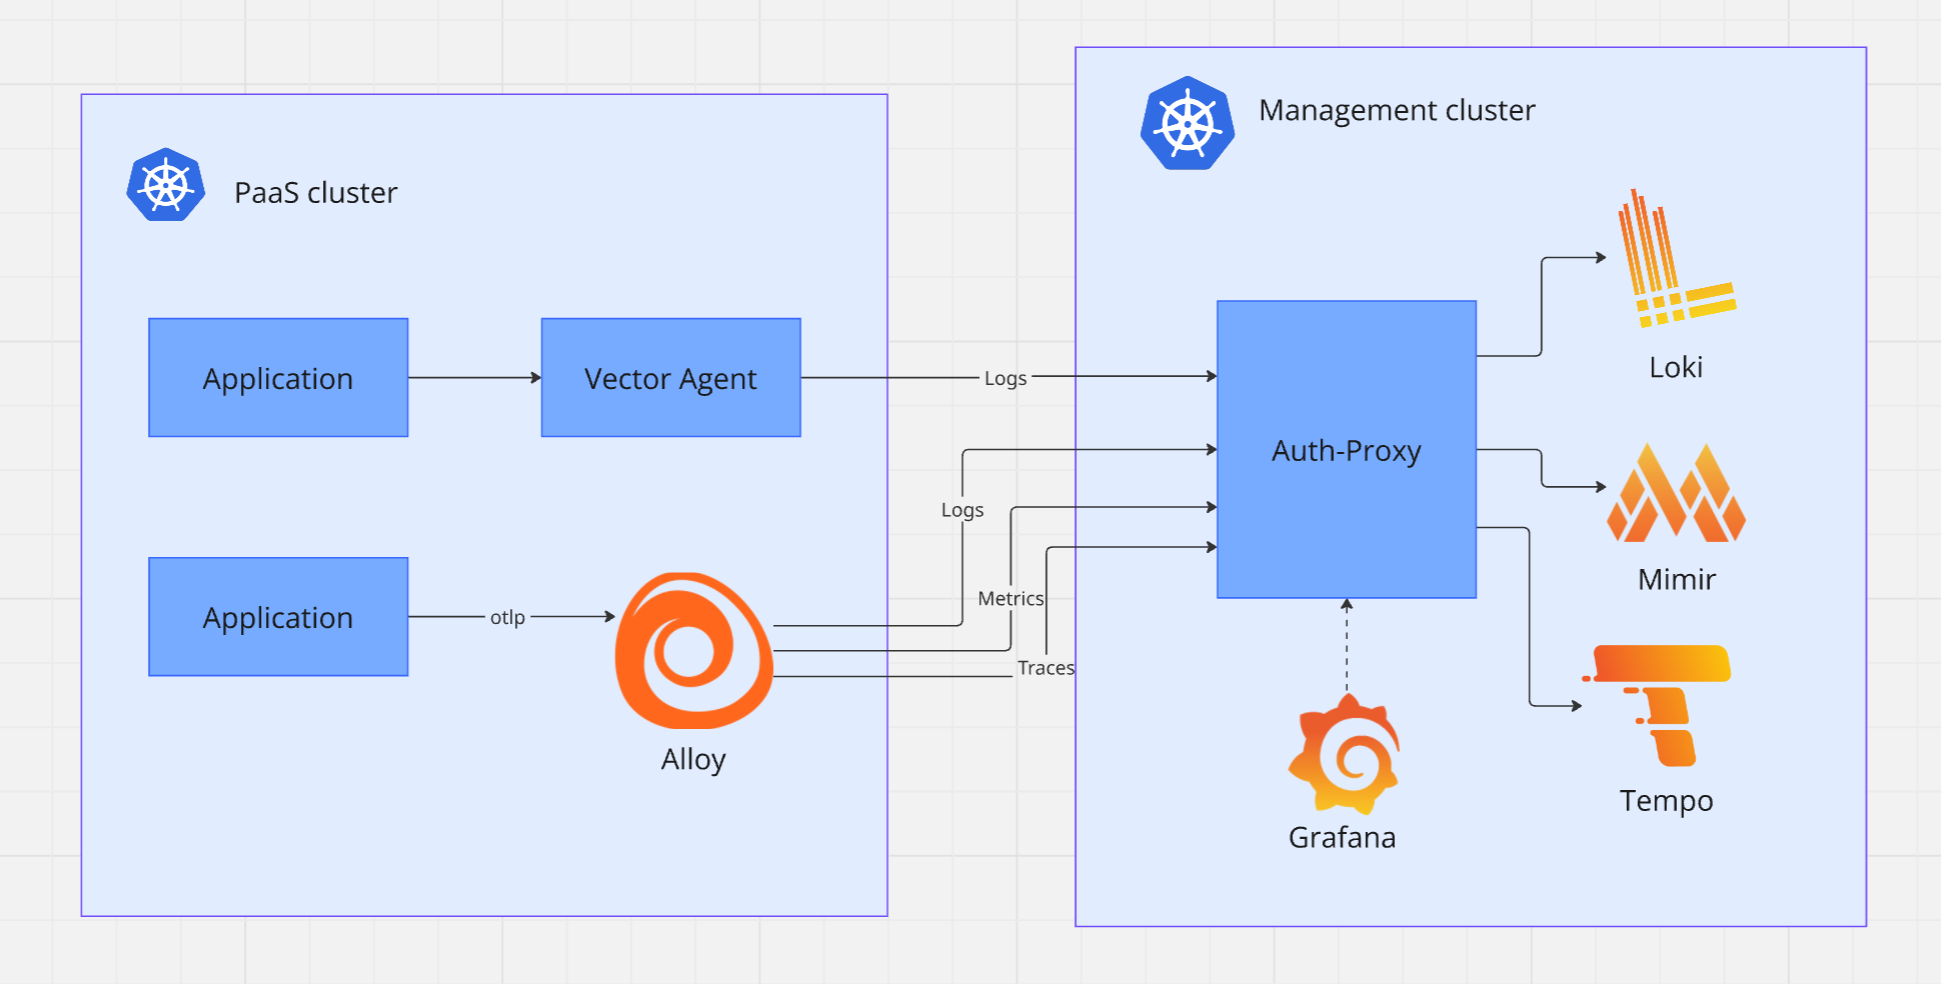
Your app to OTLP/HTTP. The OTel SDK serializes telemetry in the OTLP format and sends it over HTTP on port 4318. gRPC also works, but plain HTTP is sufficient. You configure this with two environment variables (OTEL_EXPORTER_OTLP_ENDPOINT and OTEL_EXPORTER_OTLP_PROTOCOL). See PaaS Full Observability for details.
Alloy. An in-cluster collector. It enriches telemetry with Kubernetes metadata (pod name, namespace) and assigns it to the correct tenant. You do not configure the tenant in your application — Alloy does it based on the namespace your workload runs in.
Loki, Mimir, and Tempo. The backends. Loki stores logs, Mimir stores metrics, Tempo stores traces. All three are pre-wired as data sources in your team's Grafana organization.
Grafana. Where you read everything, at grafana.platon.sikt.no.
If you run on Platon PaaS, you already get Kubernetes metrics (CPU, memory, pod restarts) in Mimir regardless of whether you ship OTel. See What you get for free on PaaS.
Minimal instrumentation example
The following is a minimal OTel setup in Python with FastAPI, taken from the course-catalog example app:
# --- SDK setup: enable OpenTelemetry for this process ---
from opentelemetry import trace, metrics
from opentelemetry.sdk.trace import TracerProvider
from opentelemetry.sdk.trace.export import BatchSpanProcessor
from opentelemetry.exporter.otlp.proto.http.trace_exporter import OTLPSpanExporter

trace.set_tracer_provider(TracerProvider())
trace.get_tracer_provider().add_span_processor(
    BatchSpanProcessor(OTLPSpanExporter())  # endpoint comes from OTEL_EXPORTER_OTLP_ENDPOINT env var
)

# --- Auto-instrumentation: wire OTel into FastAPI and the logger ---
from opentelemetry.instrumentation.fastapi import FastAPIInstrumentor
from opentelemetry.instrumentation.logging import LoggingInstrumentor

FastAPIInstrumentor.instrument_app(app)   # every HTTP request becomes a span
LoggingInstrumentor().instrument()        # every log line gets trace_id and span_id

# --- Custom instrumentation: one hand-written span and counter ---
tracer = trace.get_tracer("course_catalog")
course_views = metrics.get_meter("course_catalog").create_counter("course_catalog.course_views")

@app.get("/courses/{course_id}")
def get_course(course_id: str):
    with tracer.start_as_current_span("courses.lookup"):
        course = db.lookup(course_id)
    course_views.add(1, {"course_id": course_id})
    return course
Everything above the handler is setup written once. The handler itself is ordinary business code with a single with tracer.start_as_current_span(...) wrapping the database call, and a single counter.add(1, ...) after a successful lookup. That is the entire custom instrumentation footprint — about three lines of business code.
Every example app in the repository follows the same shape in its language:
- course-catalog — Python / FastAPI (the code above)
- eligibility-checker — Java / Spring Boot
- enrollment-service — Node.js / Express
- notification-service — Go / net/http
Next steps
- Adopting OTel on Platon — environment variables, the Alloy endpoint, and PaaS specifics.
- Example apps — pick one in your language, read the README, and follow "Reading the code — start here".
- Choosing your signals — when to use a metric, a log, or a span, with common anti-patterns.
For deeper background, the OpenTelemetry documentation is the authoritative reference, and the CNCF OpenTelemetry project page tracks the wider ecosystem.